Discovery and define
Overview
This page covers my work on research, analysis and planning. There are also samples where I used generative AI as part of my process like research.
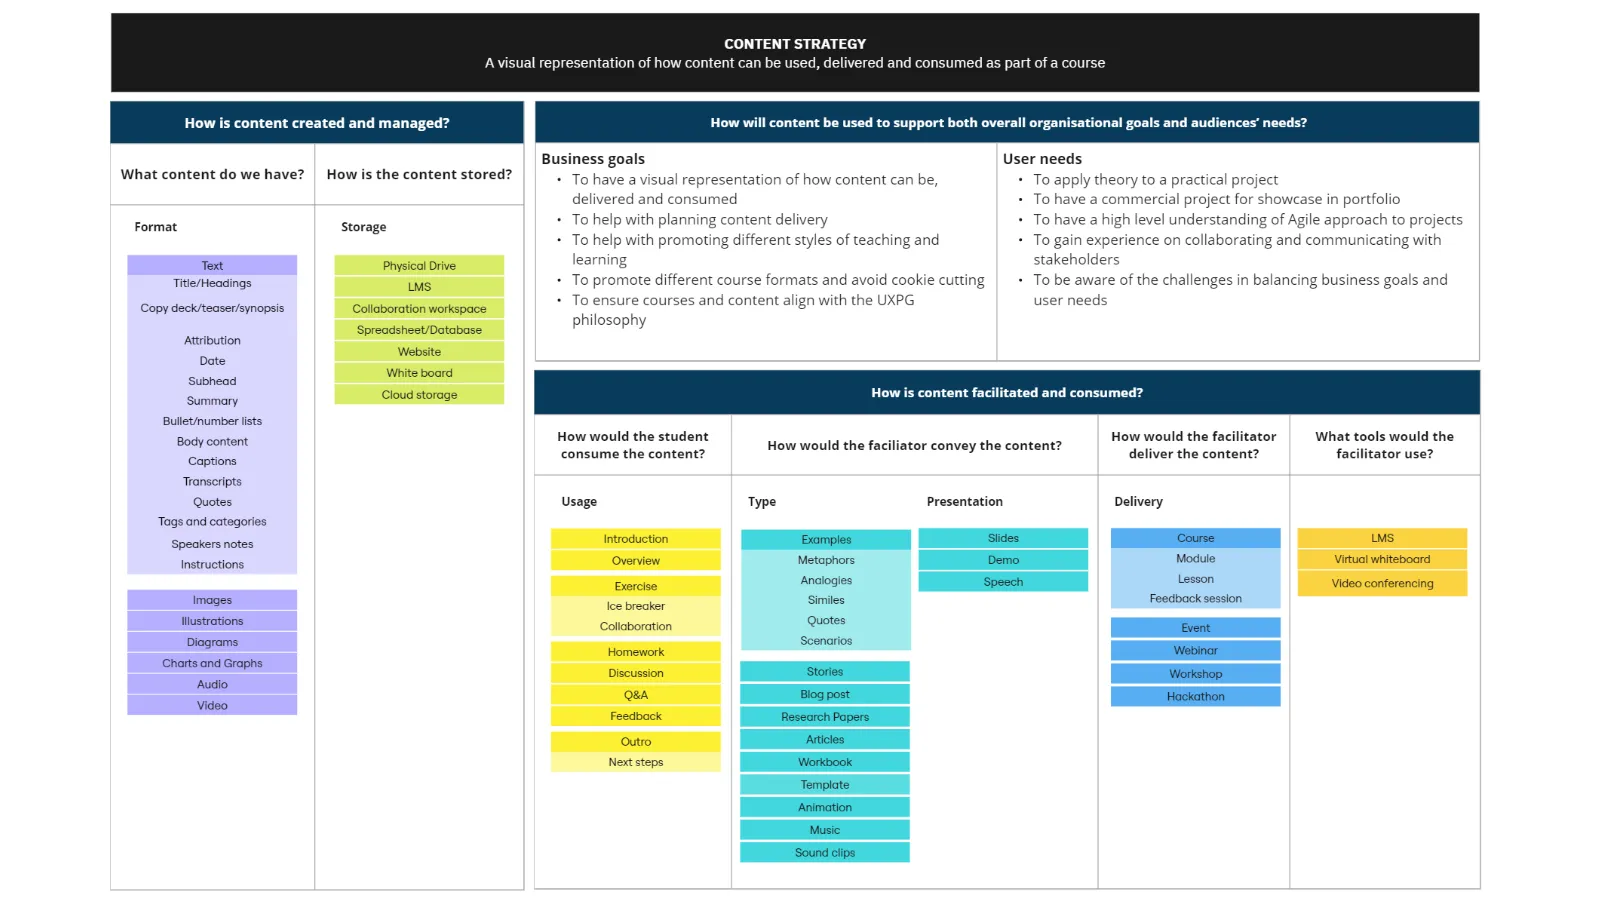
Content strategy: planning for content required for launching an online UX design course
For the development of UX Playground's online UX design course, one of the requirements was to reuse relevant existing content for the curriculum. During the planning phase, a content strategy plan was created to identify if we needed to create new content. By considering the business goals and user needs, the plan provided a useful reference to understand the tasks required to complete development and launch of the online course.
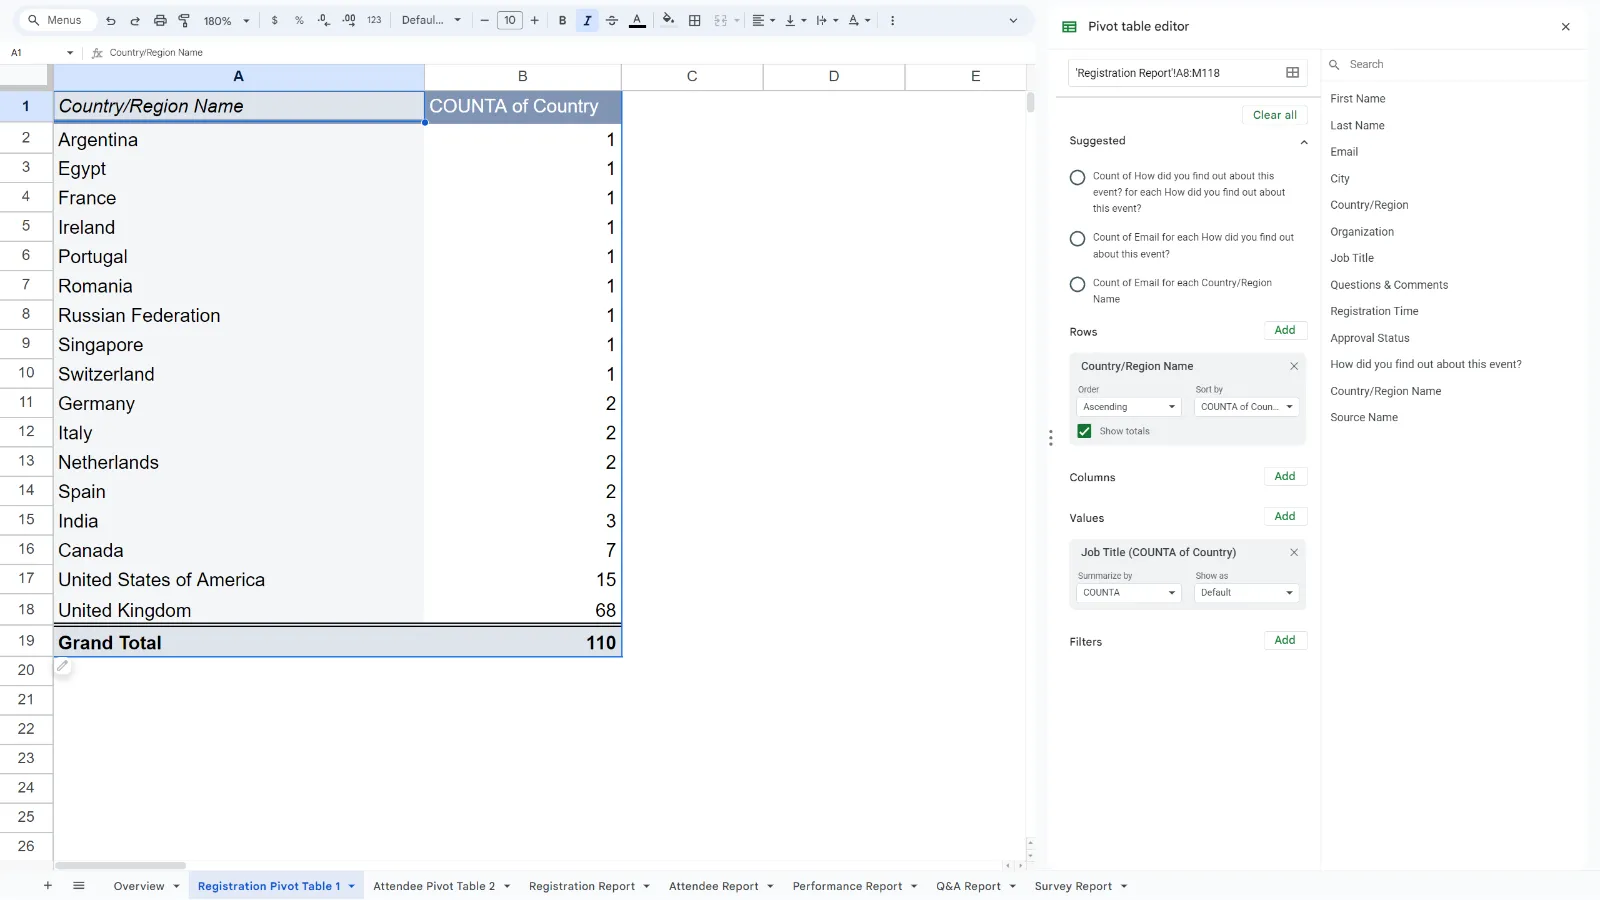
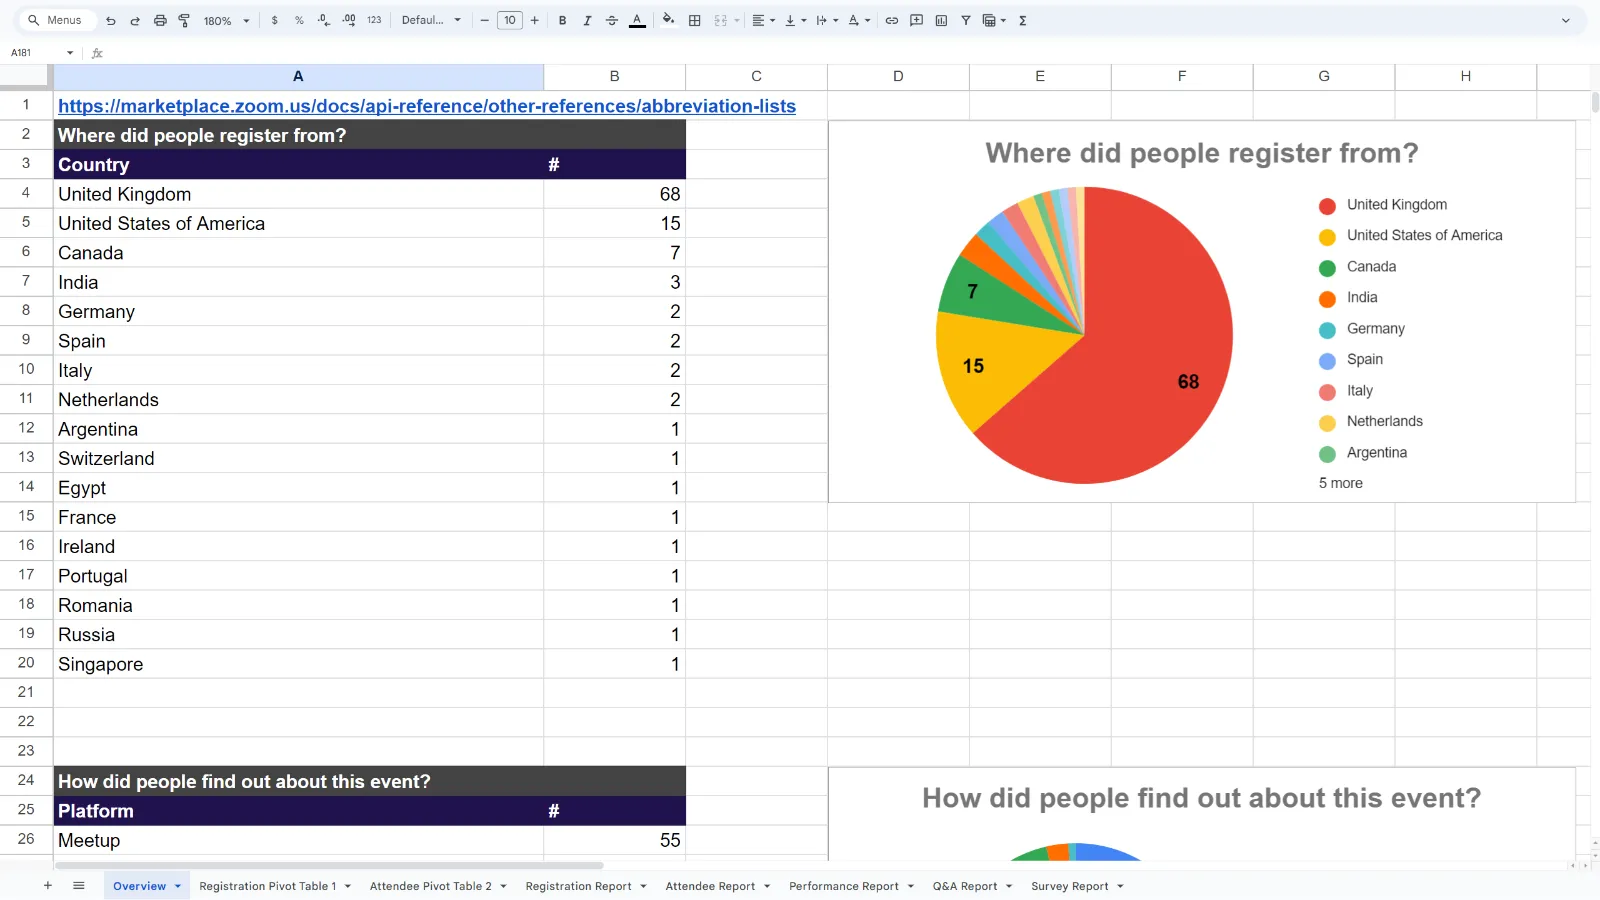
Data analysis: reporting on community event performances
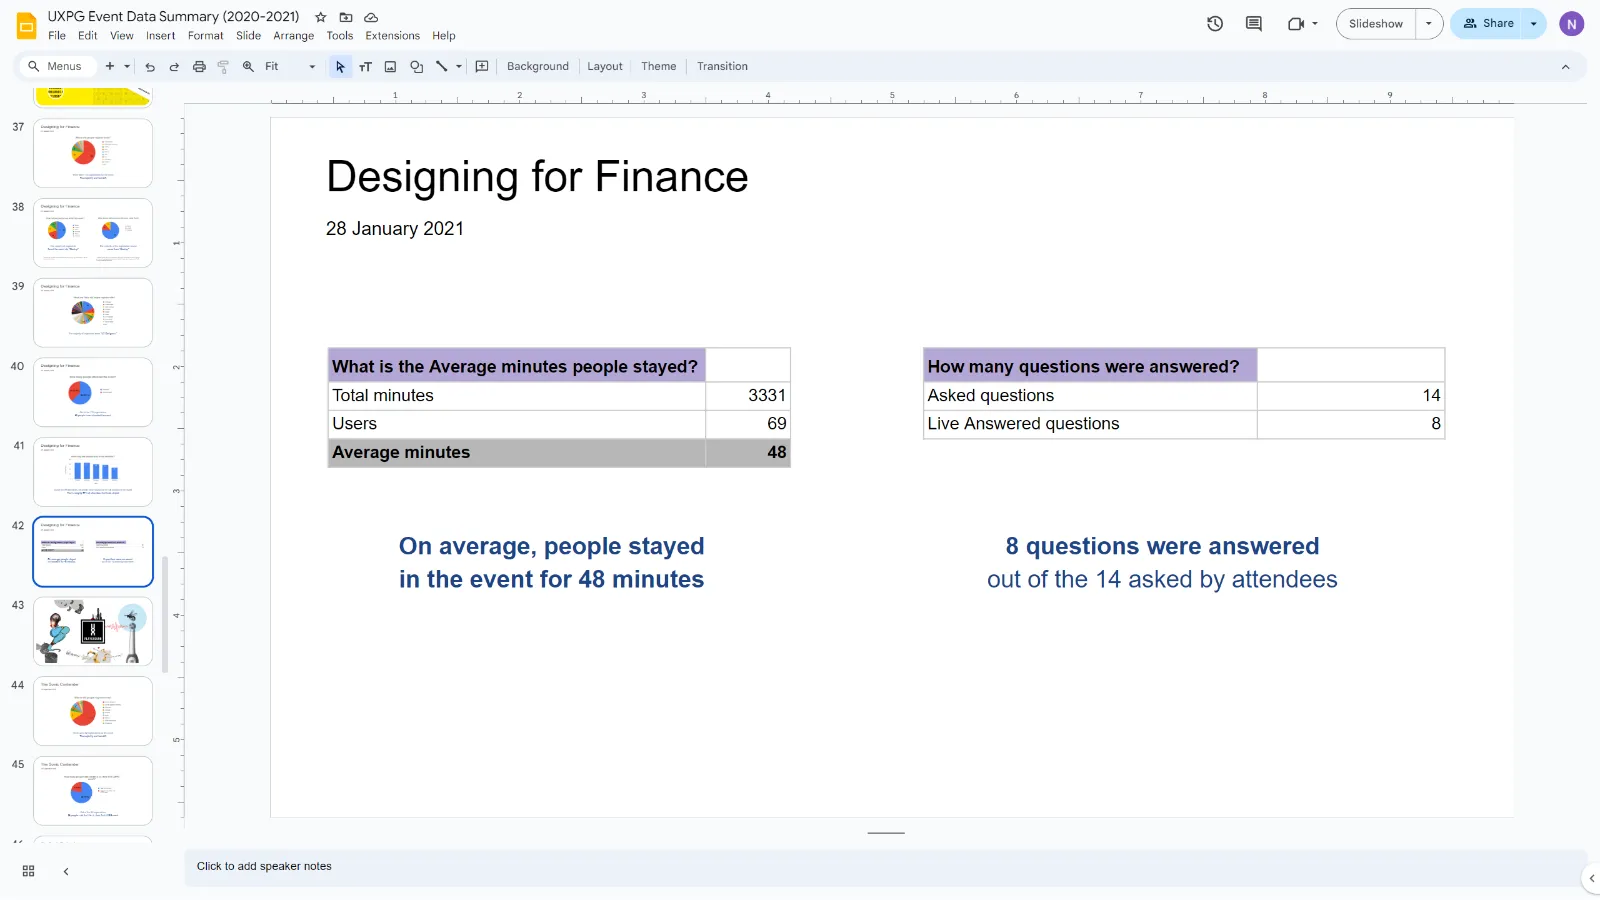
When UX Playground started running online events via Zoom, I analysed the event data collected to learn about the demographics and engagement levels during the sessions. I compiled my analysis of metrics like attendance numbers, location of attendees, and chat participation into a reporting deck. This allowed the team to review the performance of each event and how they compare based on the different topic areas covered, providing valuable insights on optimising future community events.
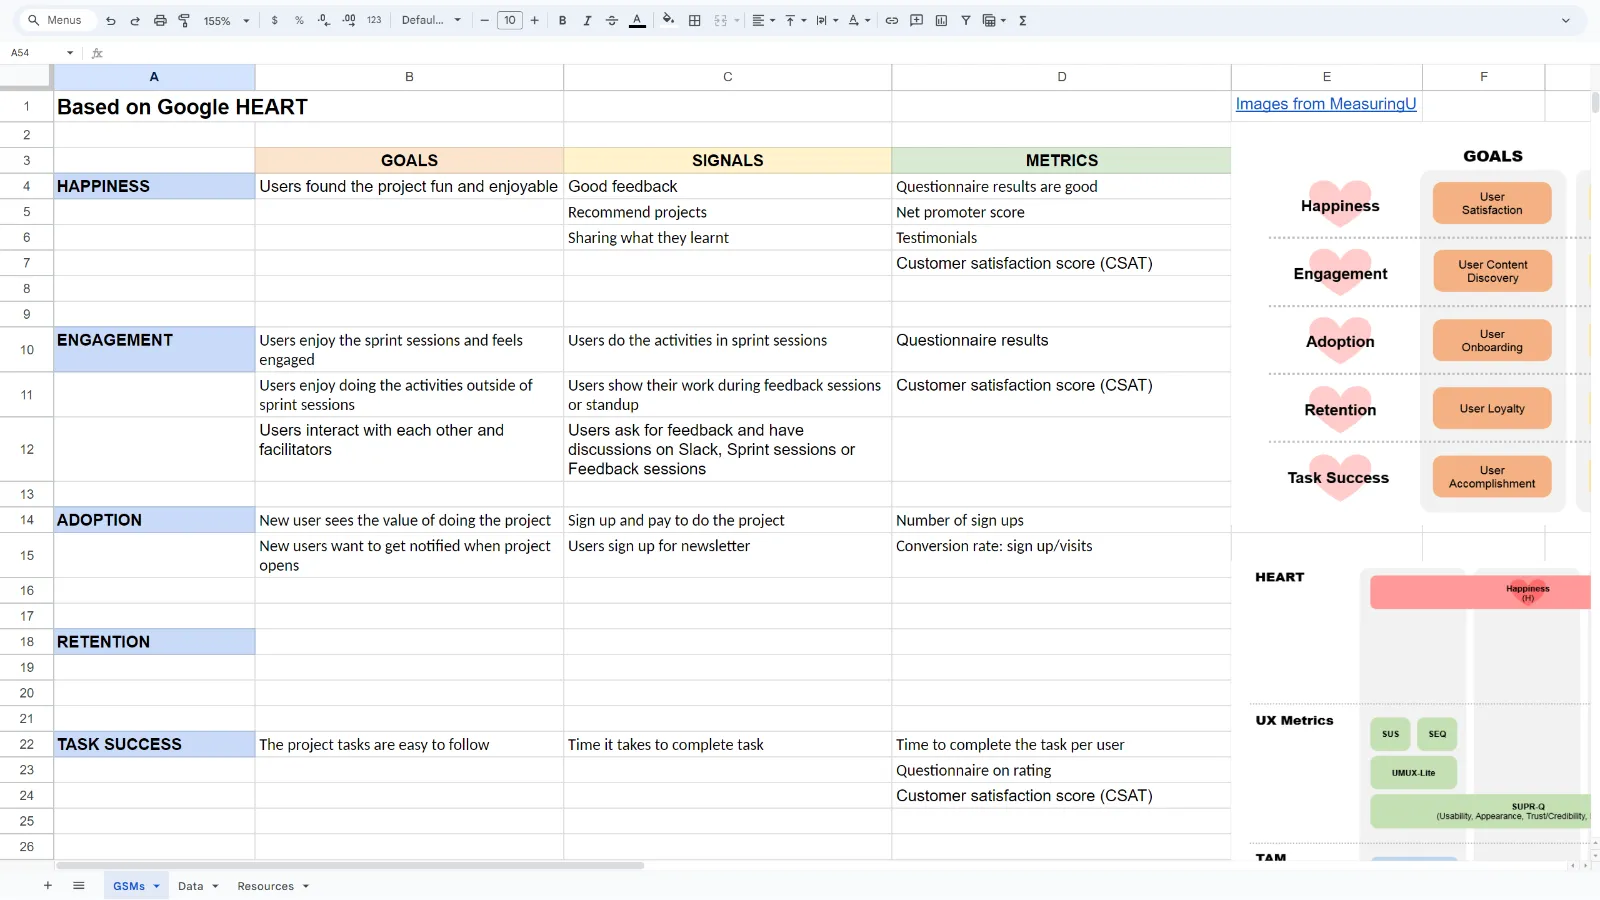
Data analysis: identifying success UX metrics for a design course
I did an activity to learn about how to identify potential UX metrics for projects. One framework I discovered was a combination of HEART and PULSE integrated into a GSM matrix. I applied this onto UX Playground's UX design course to identify potential success metrics based on feedback collected from the participant survey. Generally, businesses collect overwhelming amounts of data and I find the framework to be useful for strategic planning.
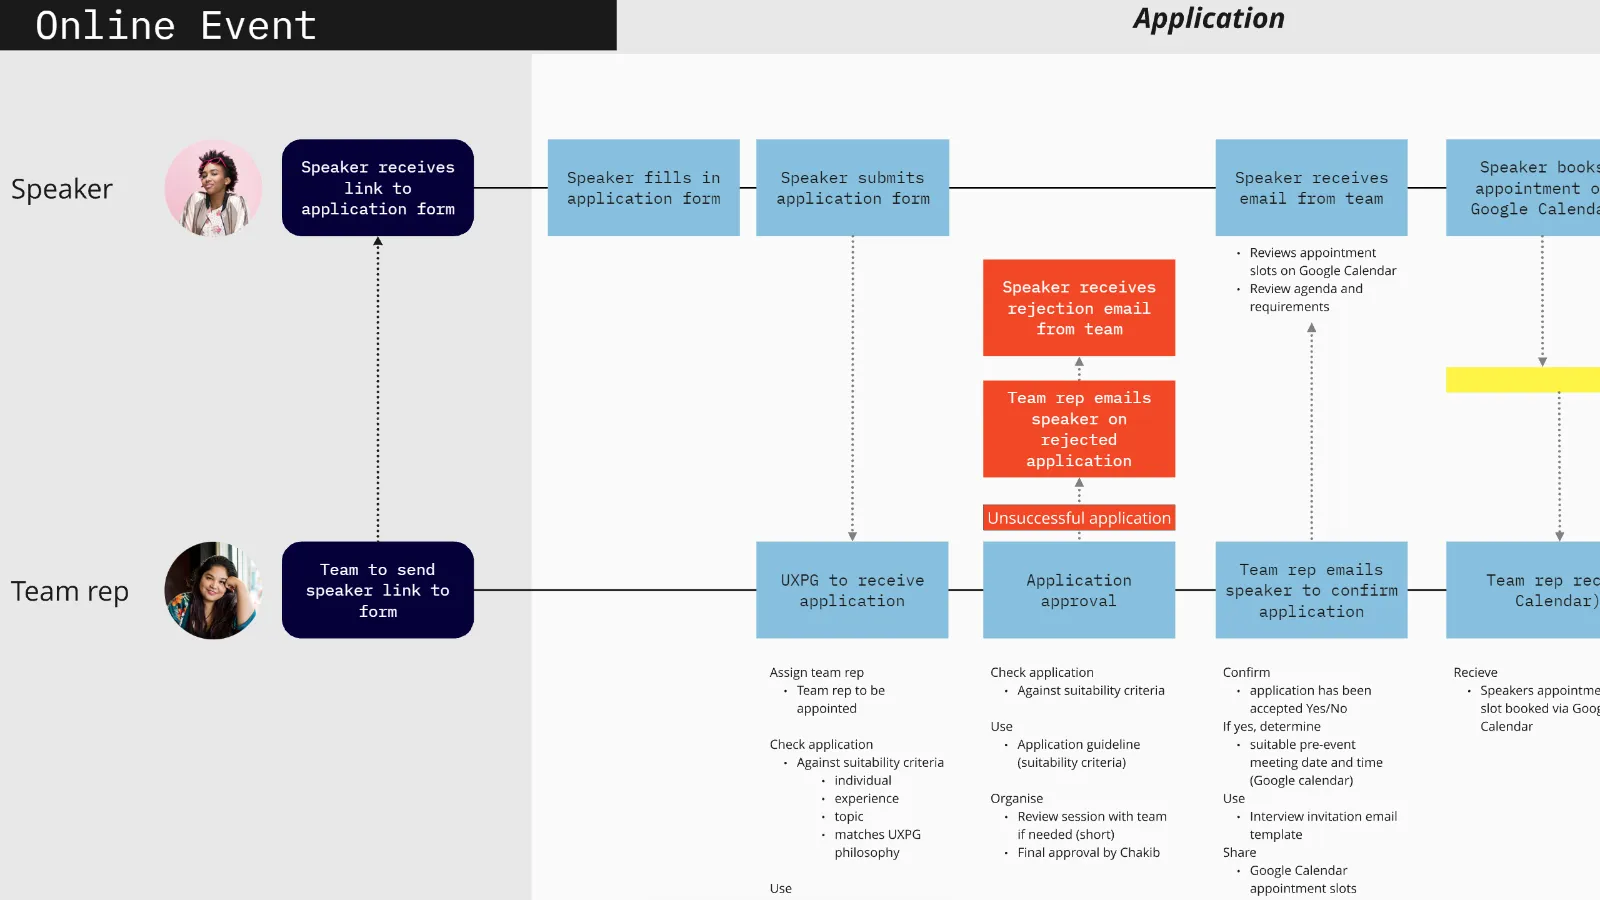
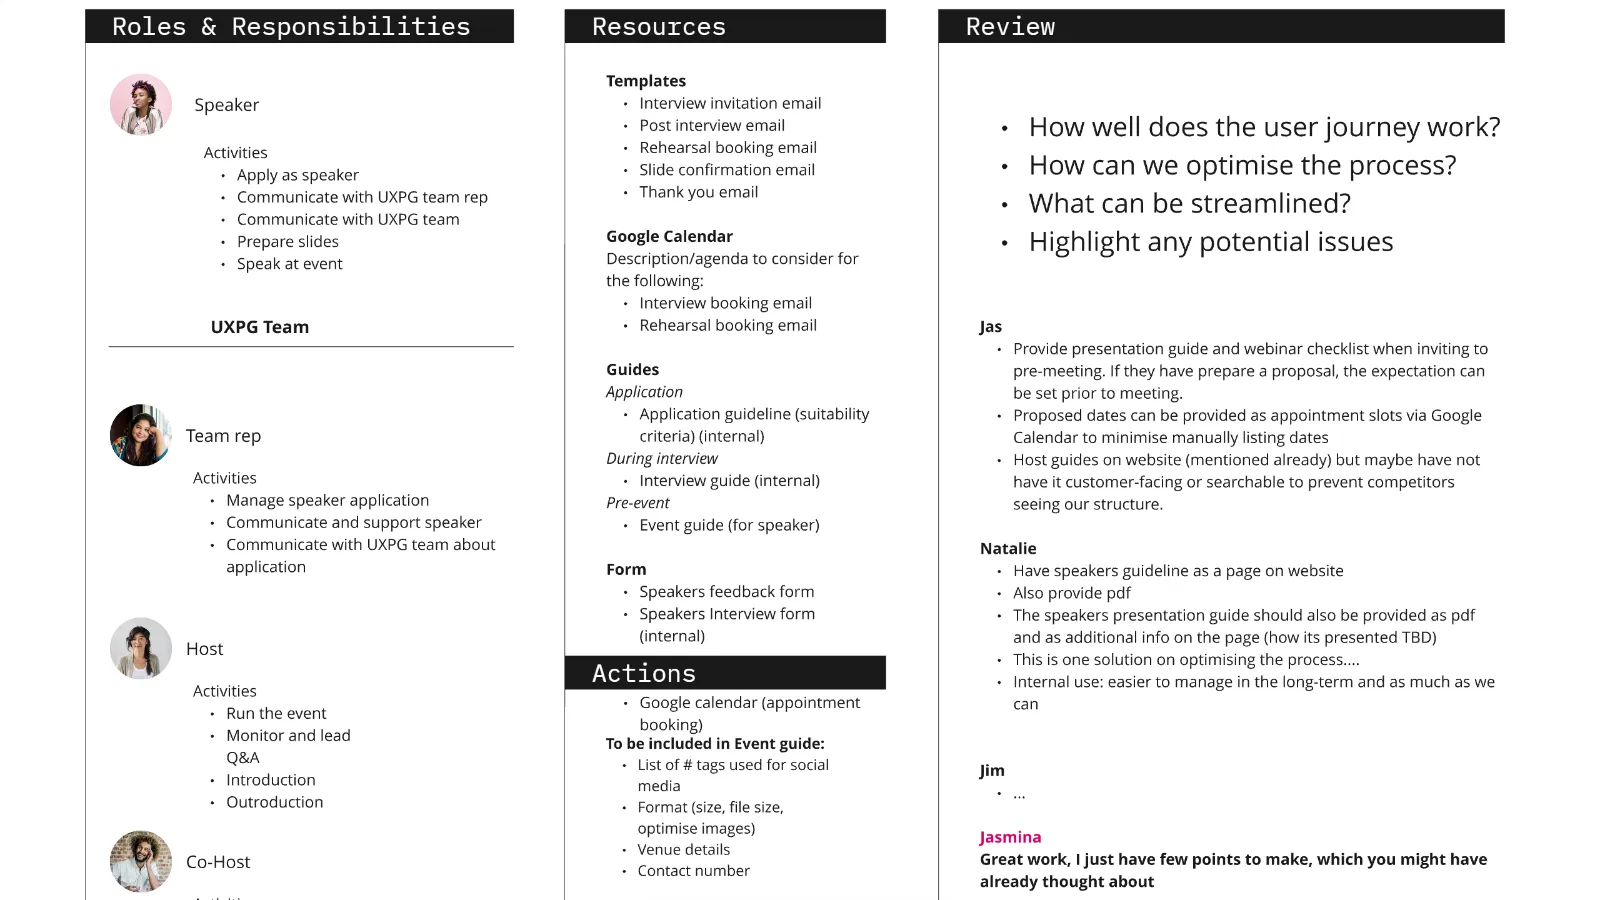
Journey mapping and personas: streamlining an event speaker management process
UX Playground frequently hosted events featuring guest speakers. To help manage resources, we created journey maps covering the end-to-end speaker management process. Personas were used to identify the various roles and responsibilities involved, as well as touchpoints for communicating key information between stakeholders. This activity clarified expectations between the team and event partners, resulting in an optimised speaker management process.
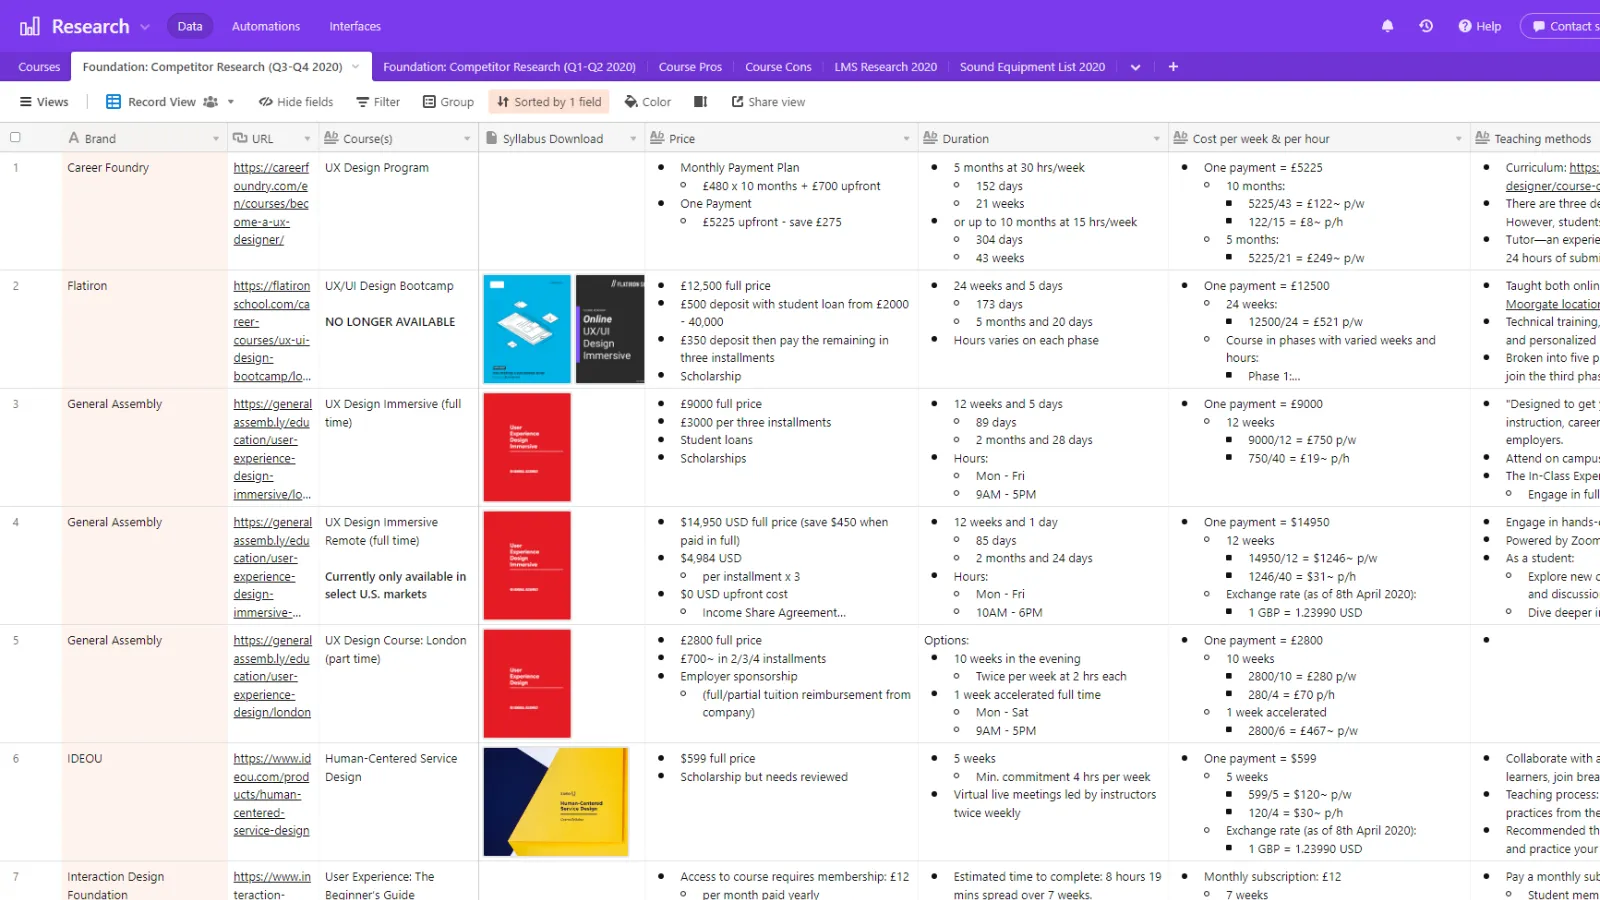
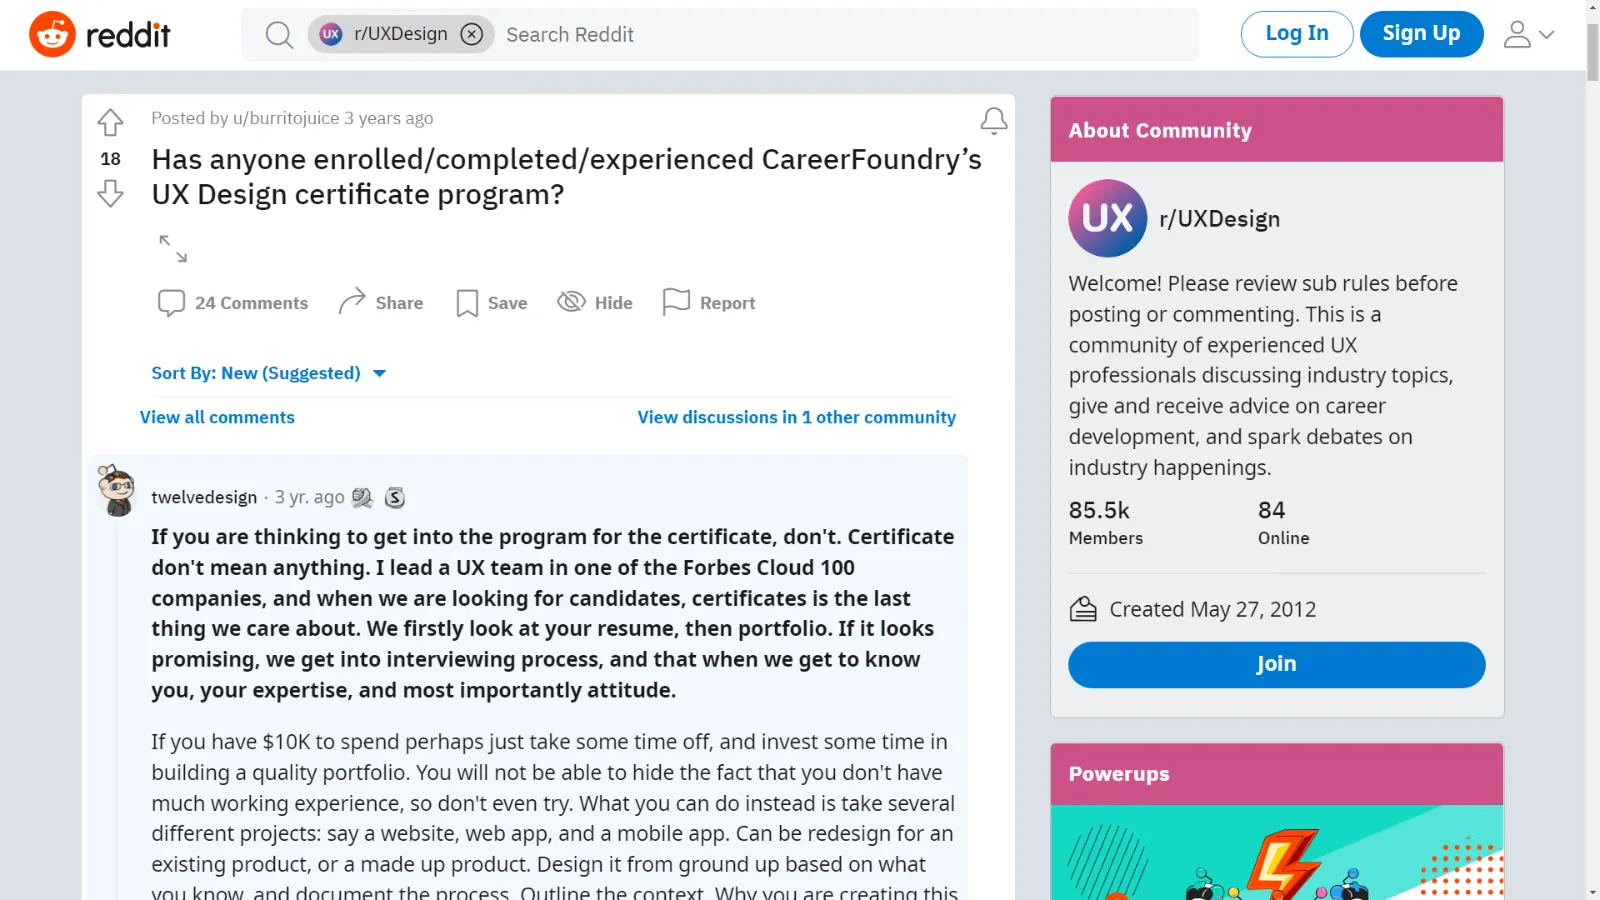
Secondary research: competitor analysis and market research of UX design courses to inform course development.
To inform the development of UX Playground's online UX design course, I conducted market research and competitor analysis of other courses to gather insights into their teaching methods, durations, prices and customer feedback. The analysis provided useful references in helping my team to determine the appropriate pricing, optimal duration and effective teaching approach for the online course.
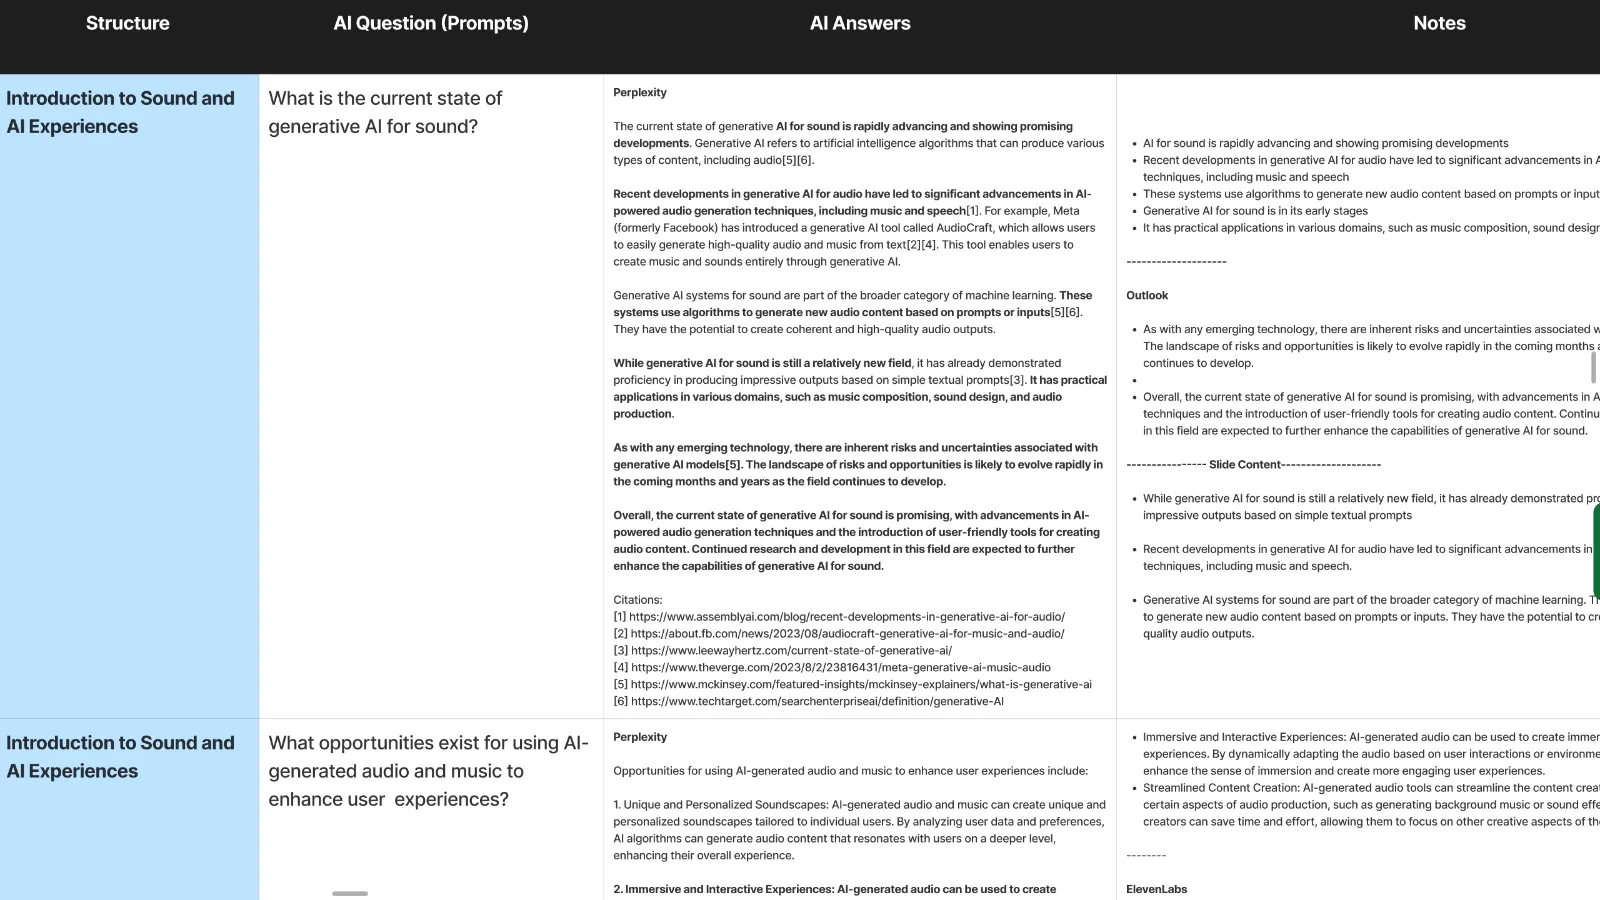
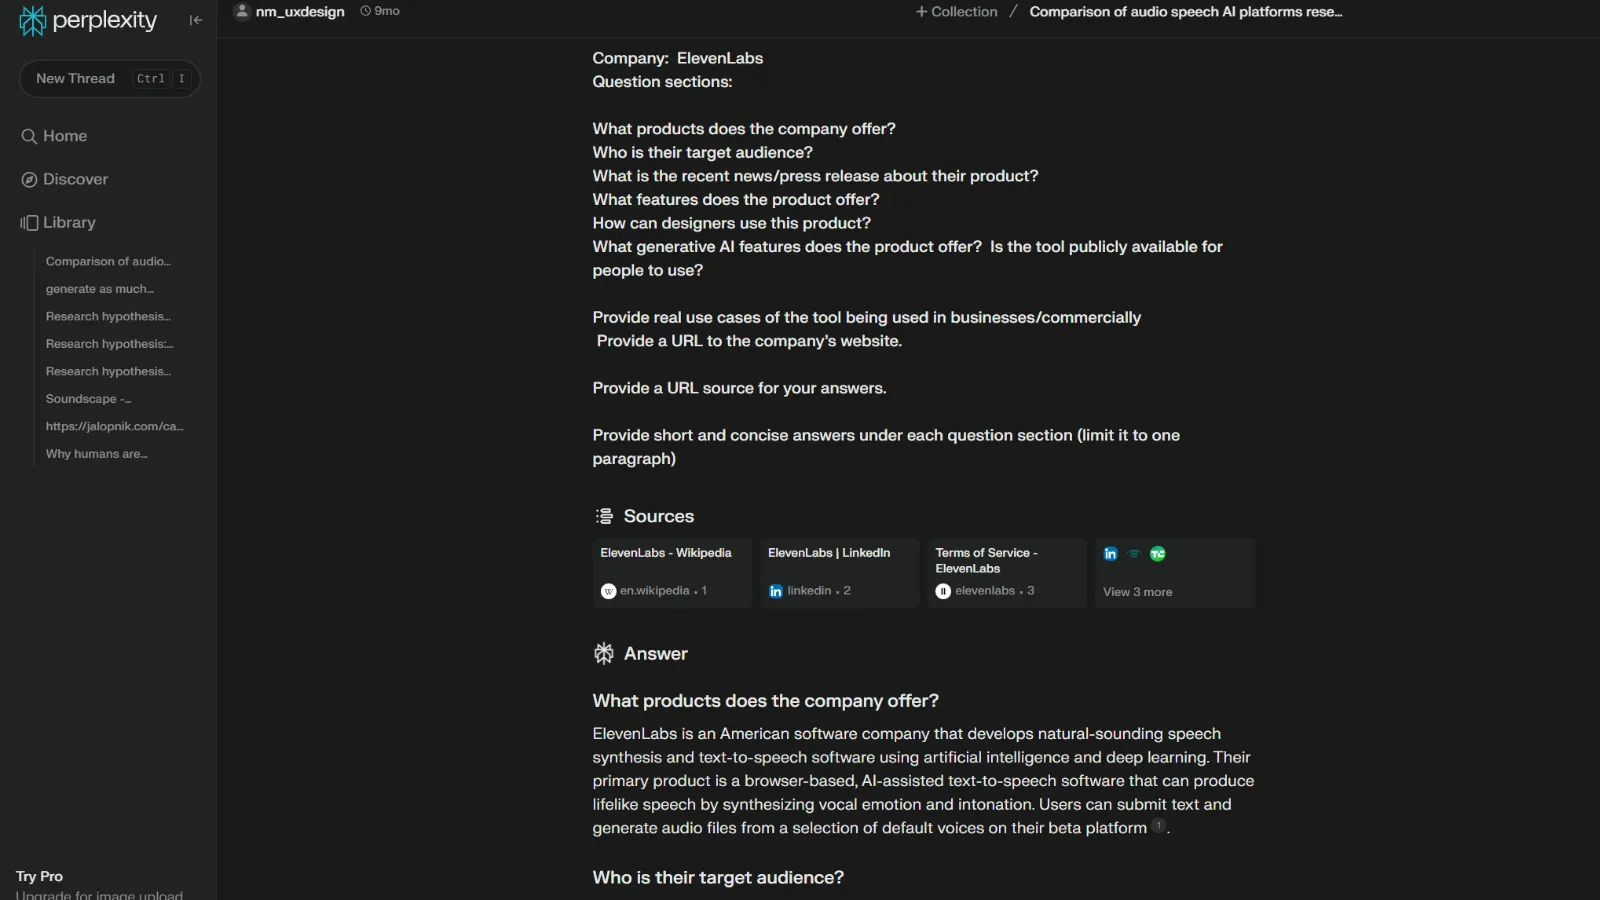
Secondary research: leveraging generative AI for researching "Sound and AI" for Capgemini's Level Up event
At UX Playground, me and my team had the opportunity to present at Capgemini's 'Level Up' event, with the topic theme focused on 'generative AI'. Based on the success of our previous research presentation on sound design in user experience, we decided to explore how AI could enhance our secondary research process for this follow-up presentation. The project was a great opportunity for me to explore different AI tools and gain valuable insights into current AI capabilities and limitations for design research.
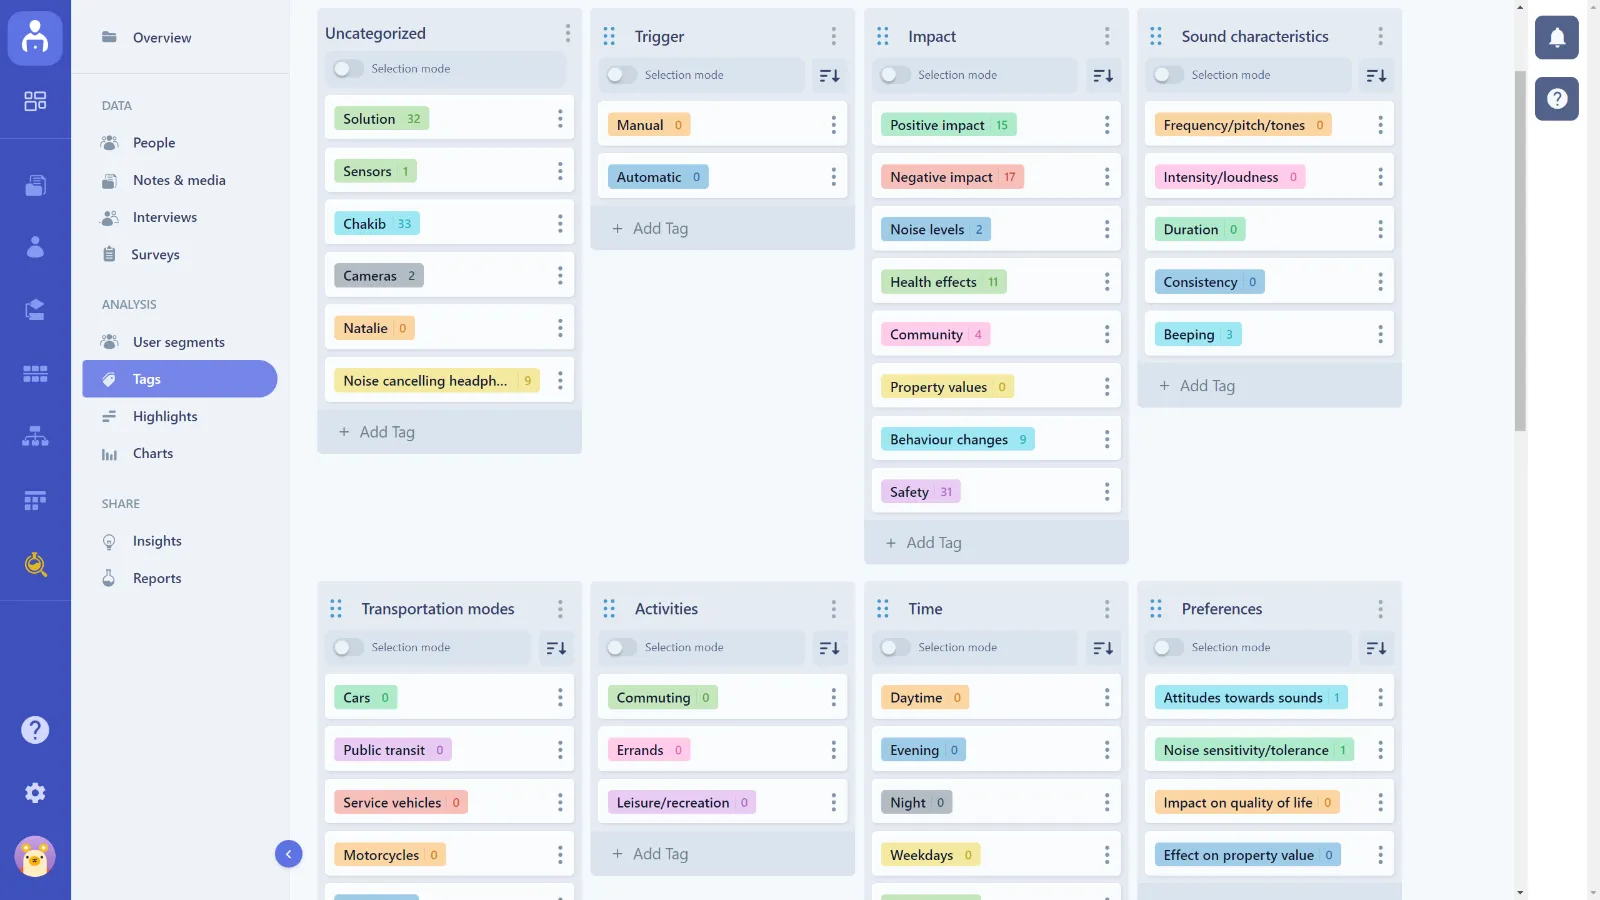
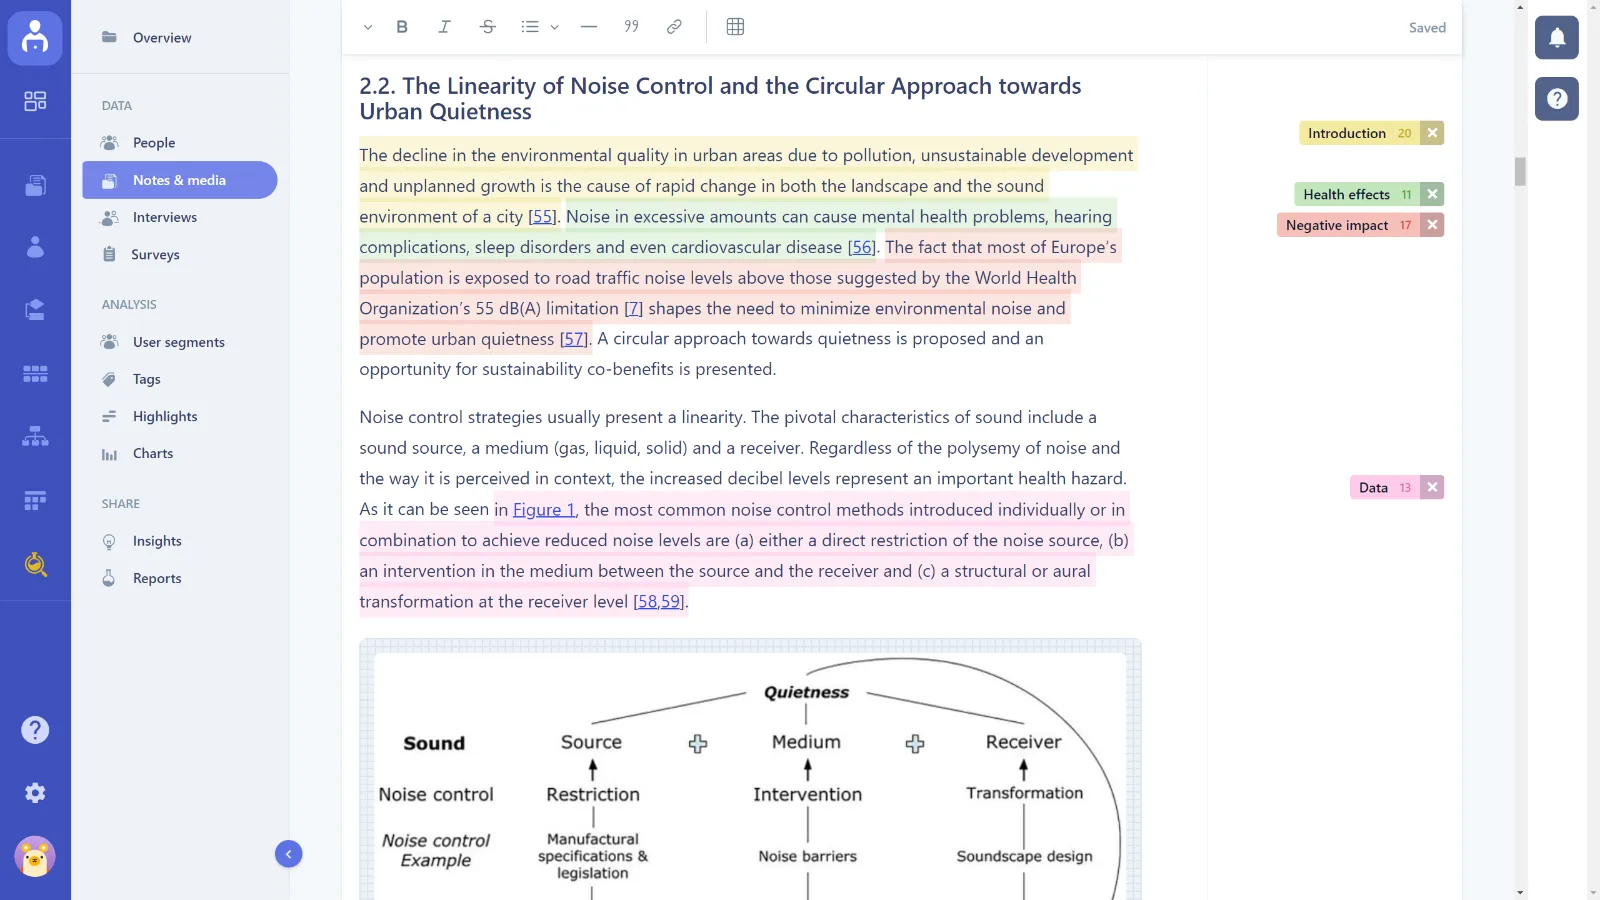
Secondary research: thematic analysis for article topics
The UX Playground team wanted to publish a series of articles on multisensory design and technology as a new community initiative. Having previously compiled research findings into spreadsheets and databases (Google Sheets and Airtable), I used this opportunity to explore research tools like Userbit to better support data analysis. The tool enabled thematic analysis of data, allowing me to efficiently extract meaningful insights for creating articles. The tagging feature streamlined collaboration, enabling strategic planning and organisation of recurring themes from our research. These insights informed development of the content roadmap for the articles.